BelgiumMaps.StatBel: R package with Administrative boundaries of Belgium
We recently opened up the BelgiumMaps.StatBel package and made it available at https://github.com/bnosac/BelgiumMaps.StatBel. This R package contains maps with administrative boundaries (national, regions, provinces, districts, municipalities, statistical sectors, agglomerations (200m)) of Belgium extracted from Open Data at Statistics Belgium.
The package is a data-only package where maps of administrative zones in Belgium are available in the WGS84 coordinate reference system. The data is available in several objects:
- BE_ADMIN_SECTORS: a SpatialPolygonsDataFrame with polygons and data at the level of the statistical sector
- BE_ADMIN_MUNTY: a SpatialPolygonsDataFrame with polygons and data at the level of the municipality
- BE_ADMIN_DISTRICT: a SpatialPolygonsDataFrame with polygons and data at the level of the district
- BE_ADMIN_PROVINCE: a SpatialPolygonsDataFrame with polygons and data at the level of the province
- BE_ADMIN_REGION: a SpatialPolygonsDataFrame with polygons and data at the level of the region
- BE_ADMIN_BELGIUM: a SpatialPolygonsDataFrame with polygons and data at the level of the whole of Belgium
- BE_ADMIN_HIERARCHY: a data.frame with administrative hierarchy of Belgium
- BE_ADMIN_AGGLOMERATIONS: a SpatialPolygonsDataFrame with polygons and data at the level of an agglomeration (200m)
The R package is available at our rcube at www.datatailor.be under the CC-BY 2 license and can be installed as follows:
install.packages("sp")
install.packages("BelgiumMaps.StatBel", repos = "http://www.datatailor.be/rcube", type = "source")
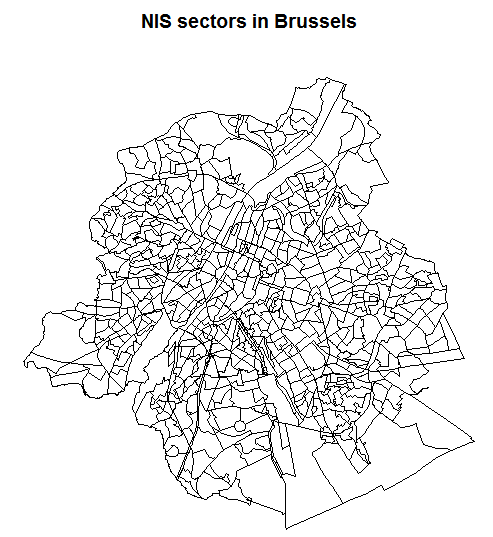
The core data of the package contains administrative boundaries at the level of the statistical sector which can easily be plotted using the sp or the leaflet package.
library(BelgiumMaps.StatBel)
data(BE_ADMIN_SECTORS)
bxl <- subset(BE_ADMIN_SECTORS, TX_RGN_DESCR_NL %in% "Brussels Hoofdstedelijk Gewest")
plot(bxl, main = "NIS sectors in Brussels")
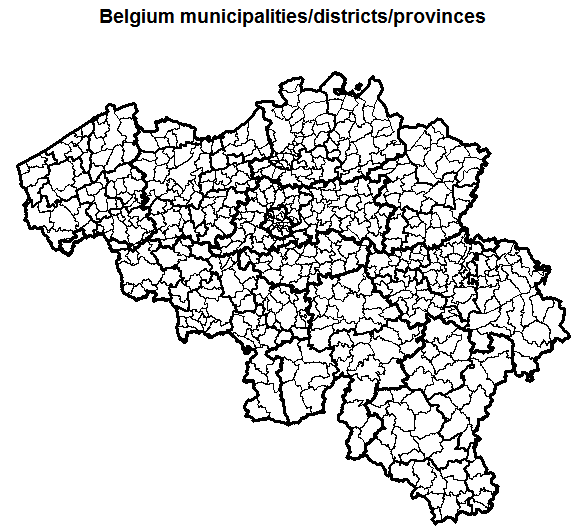
All municipalities, districts, provinces, regions and country level boundaries are also directly available in the package.
data(BE_ADMIN_SECTORS)
data(BE_ADMIN_MUNTY)
data(BE_ADMIN_DISTRICT)
data(BE_ADMIN_PROVINCE)
data(BE_ADMIN_REGION)
data(BE_ADMIN_BELGIUM)
plot(BE_ADMIN_MUNTY, main = "Belgium municipalities/districts/provinces")
plot(BE_ADMIN_DISTRICT, lwd = 2, add = TRUE)
plot(BE_ADMIN_PROVINCE, lwd = 3, add = TRUE)
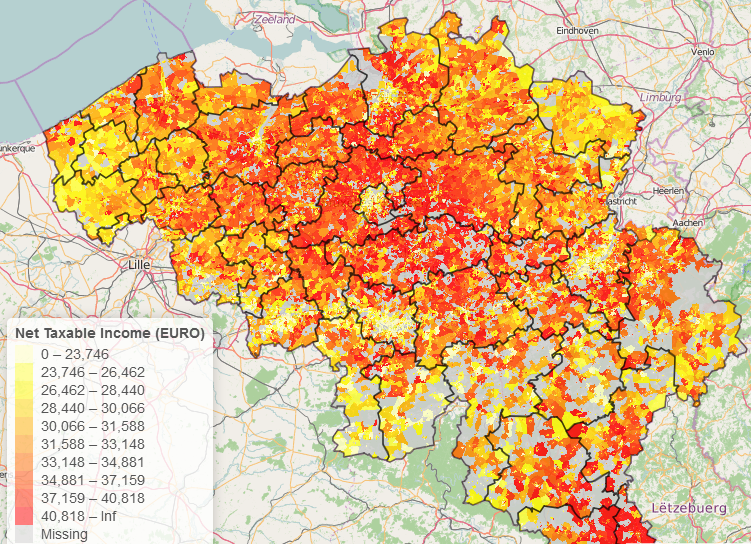
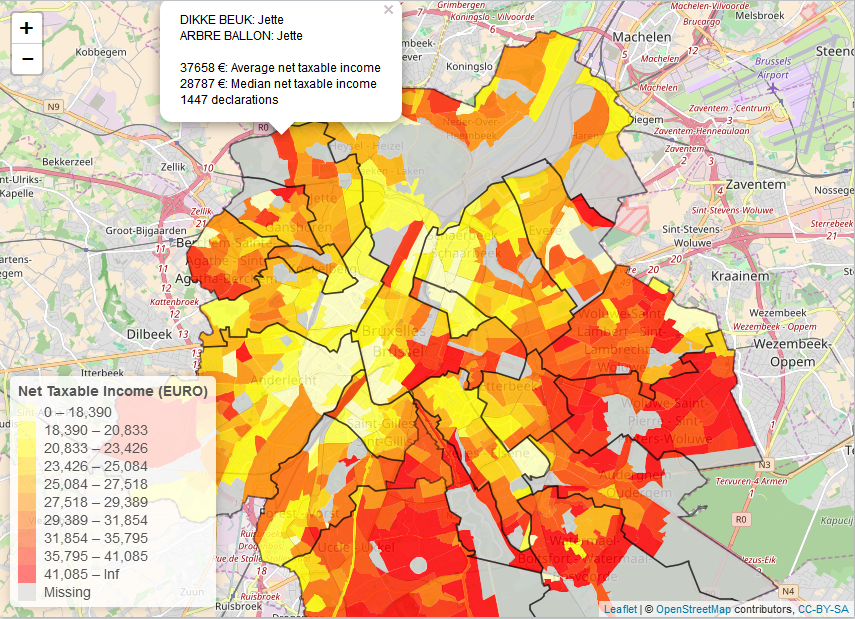
The package also integrates well with other public data from Statistics Belgium as it contains spatial identifiers (nis codes, nuts codes) which you can use to link to other datasets. The following R code example creates an interactive map displaying net taxable income by statistical code for Brussels.
If you are looking for mapping data about Belgium, you might also be interested in the BelgiumStatistics package (which can be found at https://github.com/weRbelgium/BelgiumStatistics) containing more general statistics about Belgium or the BelgiumMaps.OpenStreetMap package (https://github.com/weRbelgium/BelgiumMaps.OpenStreetMap) which contains geospatial data of Belgium regarding landuse, natural, places, points, railways, roads and waterways, extracted from OpenStreetMap.
library(BelgiumMaps.StatBel)
library(leaflet)

## Get taxes / statistical sector
tempfile <- tempfile()
download.file("http://statbel.fgov.be/nl/binaries/TF_PSNL_INC_TAX_SECTOR_tcm325-278417.zip", tempfile)
unzip(tempfile, list = TRUE)
taxes <- read.table(unz(tempfile, filename = "TF_PSNL_INC_TAX_SECTOR.txt"), sep="|", header = TRUE, encoding = "UTF-8", stringsAsFactors = FALSE, quote = "", na.strings = c("", "C"))
colnames(taxes)[1] <- "CD_YEAR"

## Get taxes in last year
taxes <- subset(taxes, CD_YEAR == max(taxes$CD_YEAR))
taxes <- taxes[, c("CD_YEAR", "CD_REFNIS_SECTOR",
"MS_NBR_NON_ZERO_INC", "MS_TOT_NET_TAXABLE_INC", "MS_AVG_TOT_NET_TAXABLE_INC",
"MS_MEDIAN_NET_TAXABLE_INC", "MS_INT_QUART_DIFF", "MS_INT_QUART_COEFF",
"MS_INT_QUART_ASSYM")]

## Join taxes with the map
data(BE_ADMIN_SECTORS, package = "BelgiumMaps.StatBel")
data(BE_ADMIN_DISTRICT, package = "BelgiumMaps.StatBel")
data(BE_ADMIN_MUNTY, package = "BelgiumMaps.StatBel")
str(BE_ADMIN_SECTORS@data)
mymap <- merge(BE_ADMIN_SECTORS, taxes, by = "CD_REFNIS_SECTOR", all.x=TRUE, all.y=FALSE)
mymap <- subset(mymap, TX_RGN_DESCR_NL %in% "Brussels Hoofdstedelijk Gewest")

## Visualise the data
pal <- colorBin(palette = rev(heat.colors(11)), domain = mymap$MS_AVG_TOT_NET_TAXABLE_INC,
bins = c(0, round(quantile(mymap$MS_AVG_TOT_NET_TAXABLE_INC, na.rm=TRUE, probs = seq(0.1, 0.9, by = 0.1)), 0), +Inf),
na.color = "#cecece")

m <- leaflet(mymap) %>%
  addTiles() %>%
  addLegend(title = "Net Taxable Income (EURO)",
    pal = pal, values = ~MS_AVG_TOT_NET_TAXABLE_INC,
    position = "bottomleft", na.label = "Missing") %>%
  addPolygons(color = ~pal(MS_AVG_TOT_NET_TAXABLE_INC),
   stroke = FALSE, smoothFactor = 0.2, fillOpacity = 0.85,
   popup = sprintf("%s: %s<br>%s: %s<br><br>%s €: Average net taxable income<br>%s €: Median net taxable income<br>%s declarations",
     mymap$TX_SECTOR_DESCR_NL, mymap$TX_MUNTY_DESCR_NL,
     mymap$TX_SECTOR_DESCR_FR, mymap$TX_MUNTY_DESCR_FR,
     mymap$MS_AVG_TOT_NET_TAXABLE_INC, mymap$MS_MEDIAN_NET_TAXABLE_INC,
     mymap$MS_NBR_NON_ZERO_INC))
#m <- addPolylines(m, data = BE_ADMIN_DISTRICT, weight = 1.5, color = "black")
m <- addPolylines(m, data = subset(BE_ADMIN_MUNTY,
  TX_RGN_DESCR_NL %in% "Brussels Hoofdstedelijk Gewest"), weight = 1.5, color = "black")
m
If you are interested in all of this, you might be interested also in attending our course on Applied Spatial Modelling with R which will be held at LStat (Leuven, Belgium) on 8-9 December 2016. More information: https://lstat.kuleuven.be/training/applied-spatial-modelling-with-r