finding contour lines
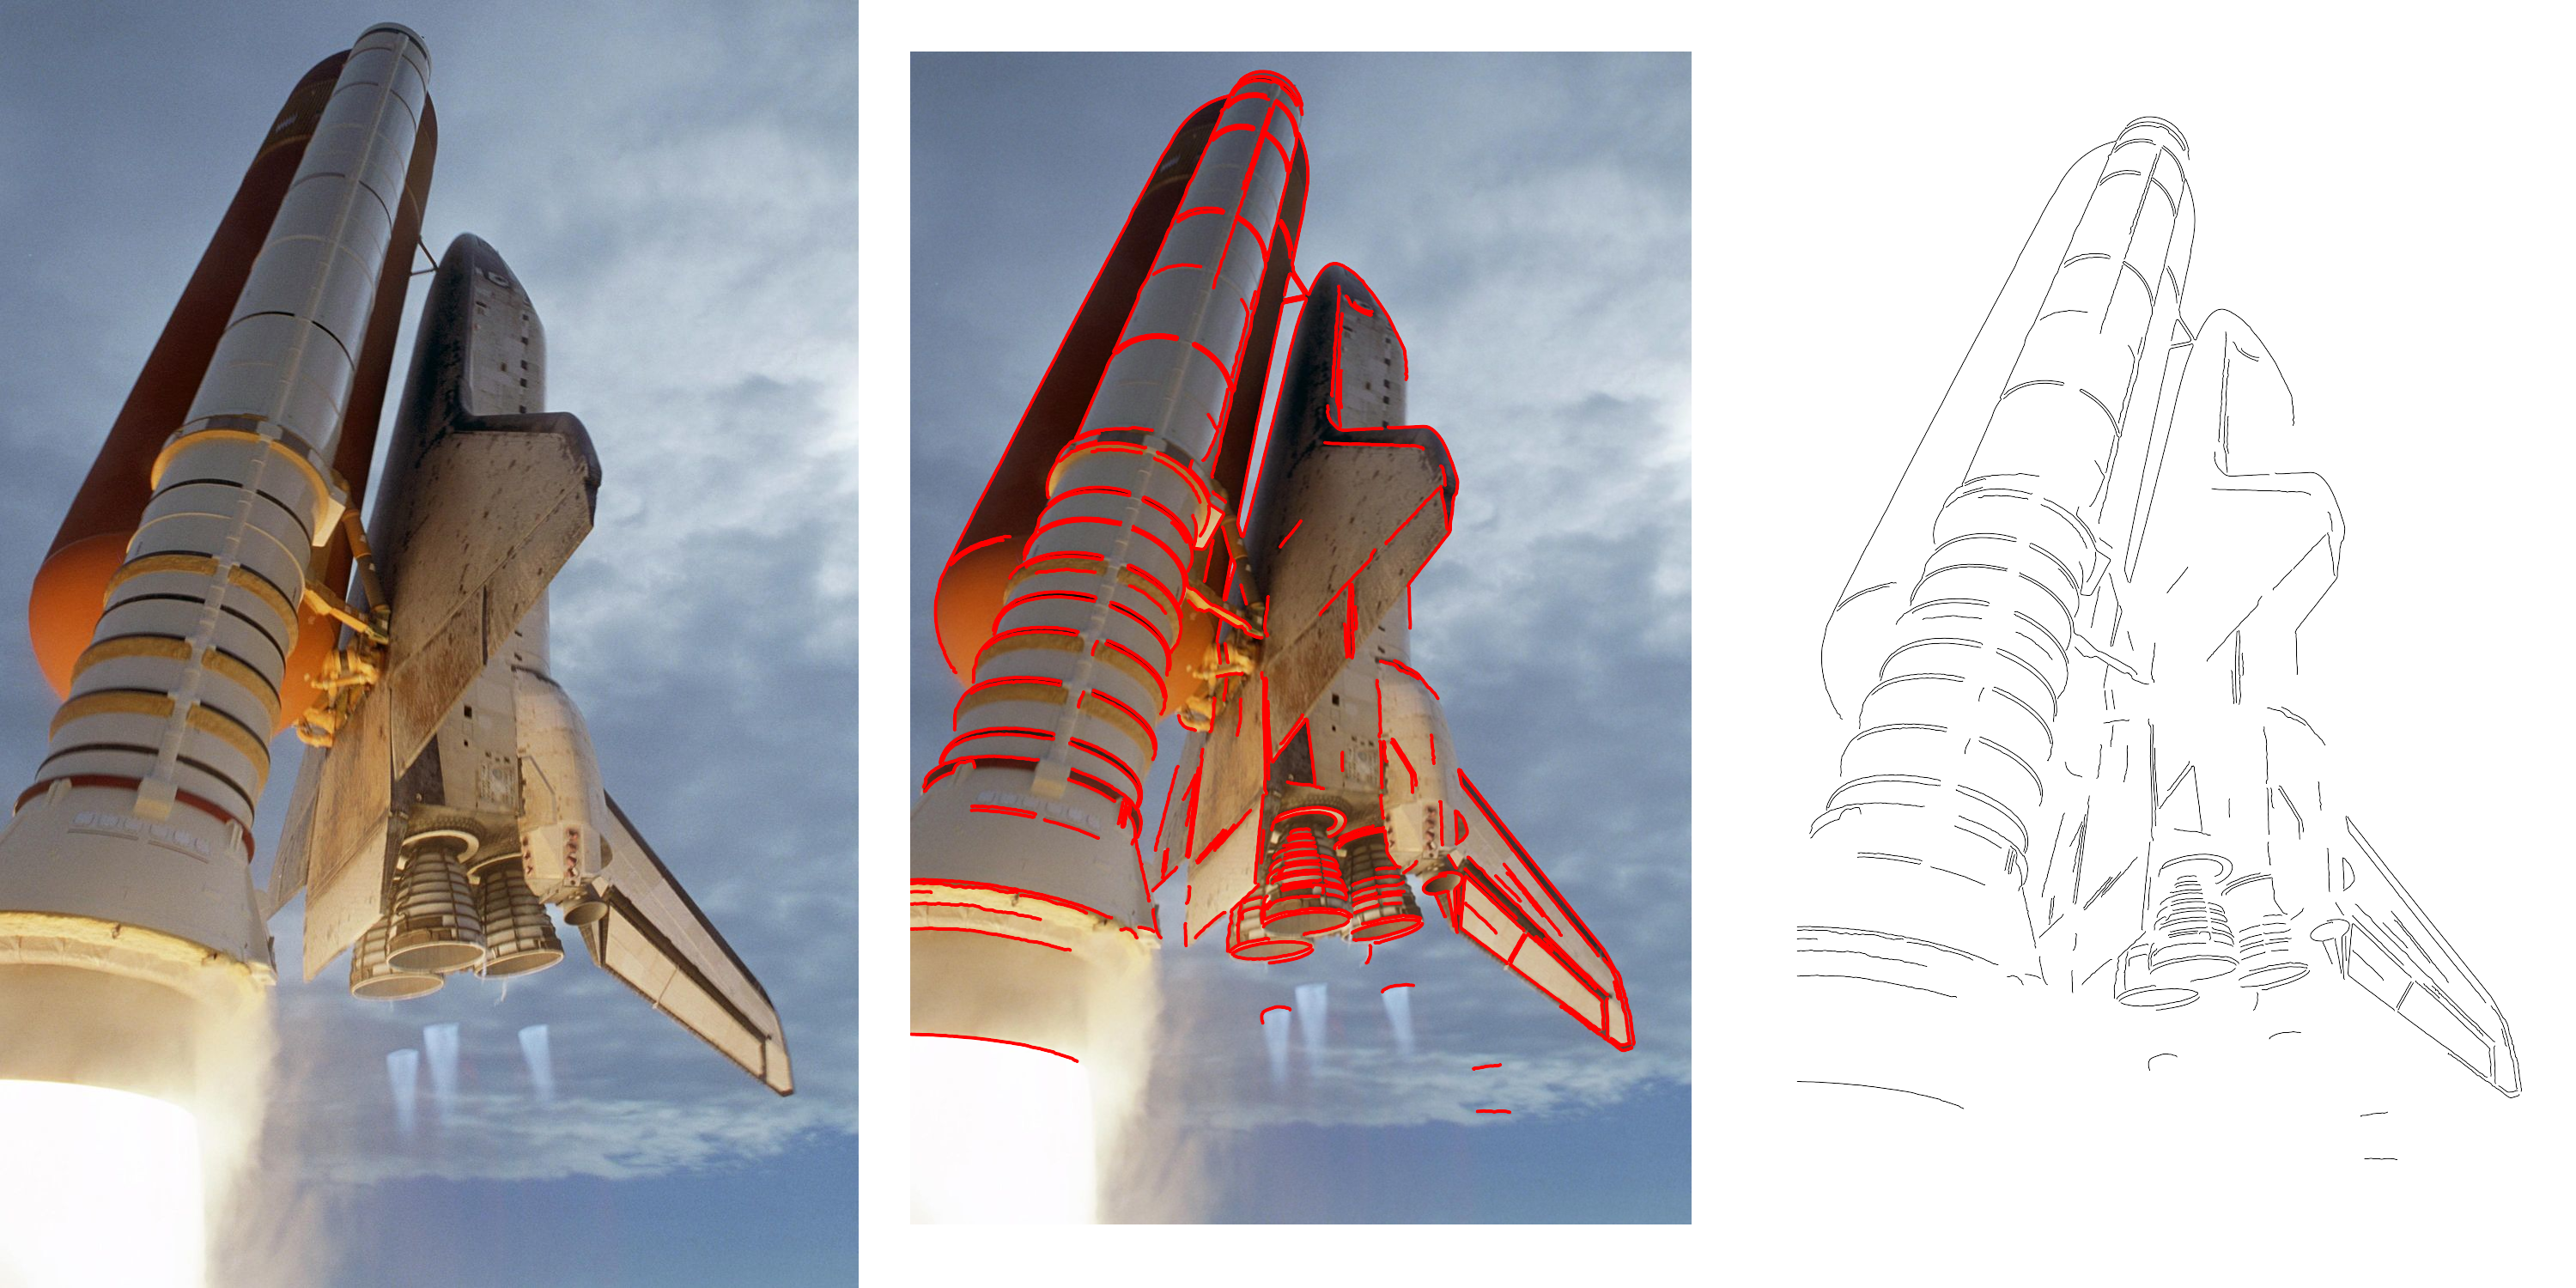
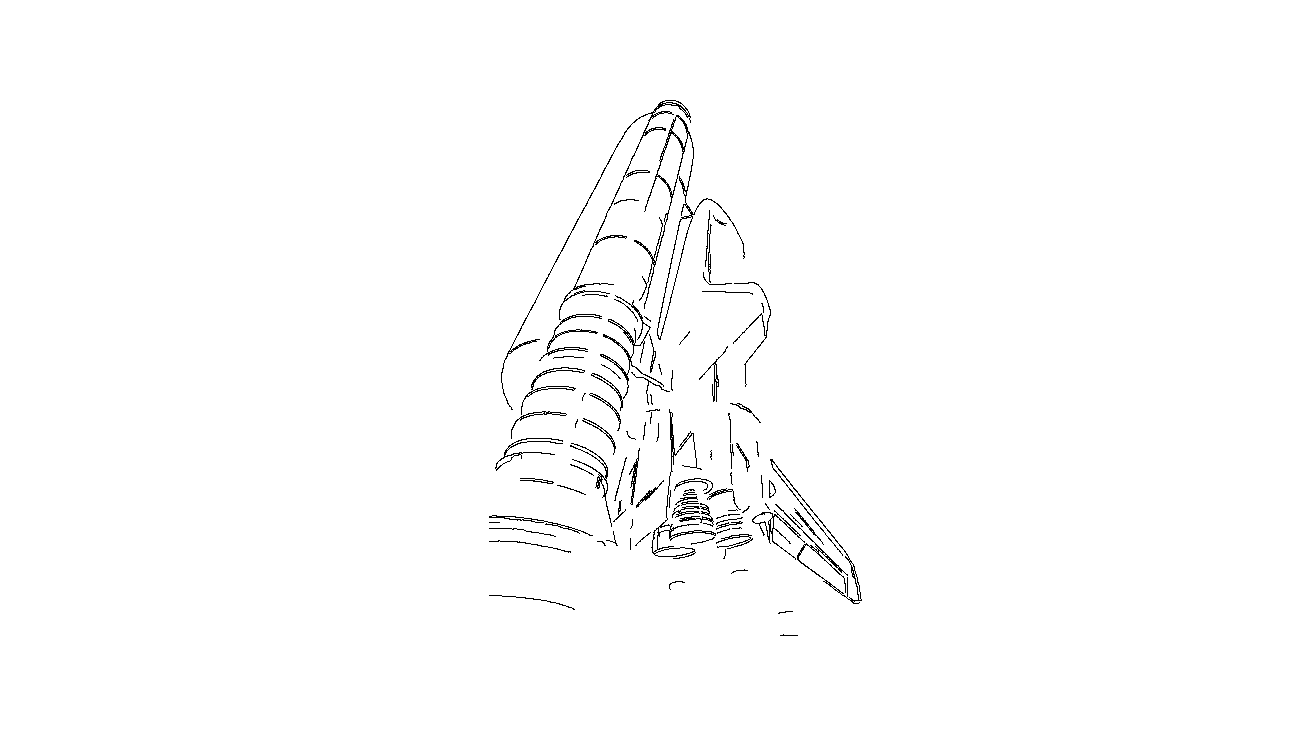
Finally, the R package you all have been waiting for has arrived - image.ContourDetector developed at https://github.com/bnosac/image. It detects contour lines in images alongside the 'Unsupervised Smooth Contour Detection' algorithm available at http://www.ipol.im/pub/art/2016/175.
Have you always wanted to be able to draw like you are in art school? Let me show how to quickly do this.
If you want to reproduce this, the following snippets show how. Steps are as follows
1. Install the packages from CRAN
install.packages("image.ContourDetector")
install.packages("magick")
install.packages("sp")
2. Get an image, put it into grey scale, pass the pixels to the function an off you go.
library(magick)
library(image.ContourDetector)
library(sp)
img <- image_read("https://cdn.mos.cms.futurecdn.net/9sUwFGNJvviJks7jNQ7AWc-1200-80.jpg")
mat <- image_data(img, channels = "gray")
mat <- as.integer(mat, transpose = TRUE)
mat <- drop(mat)
contourlines <- image_contour_detector(mat)
plt <- plot(contourlines)
class(plt)
3. If you want to have the same image as shown at the top of the article:
Put the 3 images (original, combined, contour lines only) together in 1 plot using the excellent magick R package:
plt <- image_graph(width = image_info(img)$width, height = image_info(img)$height)
plot(contourlines)
dev.off()
plt_combined <- image_graph(width = image_info(img)$width, height = image_info(img)$height)
plot(img)
plot(contourlines, add = TRUE, col = "red", lwd = 5)
dev.off()
combi <- image_append(c(img, plt_combined, plt))
combi
image_write(combi, "example-contourlines.png", format = "png")