The course is rewritten based on 3 years of extensive customer feedback and because of the tremendous evolution R has encountered in the last years. You'll learn the following in this 2-day course:
functions and vectorisation
control flow
data handling using data.table (aggregation, rbinding, reshaping)
On 22/10/2015, the Belgium government launched its Open Data initiative by releasing a number of datasets related to population statistics, fiscal information, 'kadaster', the 2011 census and some tools. Because BNOSAC works a lot with these kind of data and because we like to promote open data, an R package called BelgiumStatistics was made available for R users at https://github.com/jwijffels/BelgiumStatistics
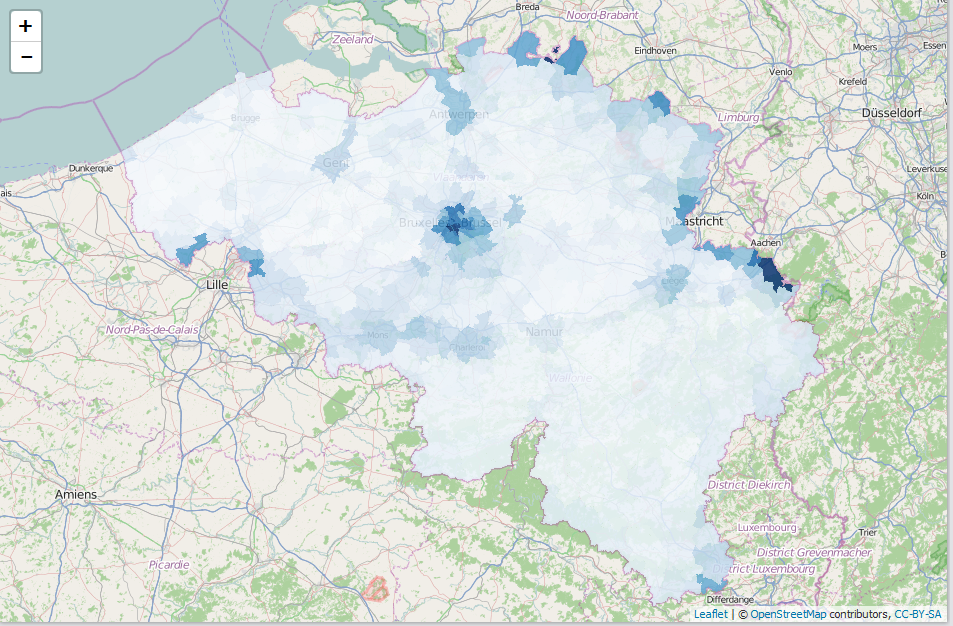
The package contains all the datasets released by Statistics Belgium (Bevolking, Werk, Leefmilieu, Census 2011) under the 'Licentie open data'. Readily available to R users. Thanks to the open data, analysing and visualising Belgium data has now become a lot smoother as the example below shows.
require(BelgiumStatistics)
require(data.table)
require(BelgiumMaps)
require(leaflet)
data(TF_SOC_POP_STRUCT_2015) ## Part of BelgiumStatistics
data(mapbelgium.fusiegemeenten.wgs) ## Part of BelgiumMaps (not released yet)

x <- as.data.table(TF_SOC_POP_STRUCT_2015)
x <- x[, list(MS_POPULATION = sum(MS_POPULATION),
              Foreigners = sum(MS_POPULATION[TX_NATLTY_NL == "Vreemdelingen"]) / sum(MS_POPULATION),
              Age = 100 * sum(MS_POPULATION * CD_AGE) / sum(MS_POPULATION),
              Females = 100 * sum(MS_POPULATION[CD_SEX == "F"]) / sum(MS_POPULATION)),
       by = list(CD_MUNTY_REFNIS, TX_MUNTY_DESCR_NL)]
x <- setDF(x)

mymap <- merge(mapbelgium.fusiegemeenten.wgs,
               x, by.x = "ORDER08", by.y = "CD_MUNTY_REFNIS", all.x=TRUE, all.y=FALSE)
mymap <- subset(mymap, !is.na(Foreigners))
pal <- colorNumeric(palette = "Blues", domain = mymap$Foreigners)
leaflet(mymap) %>%
  addTiles() %>%
  addPolygons(stroke = FALSE, smoothFactor = 0.2, fillOpacity = 0.85, color = ~pal(Foreigners))
If you are interested in geographical analysis or visualisations, Get in touch.
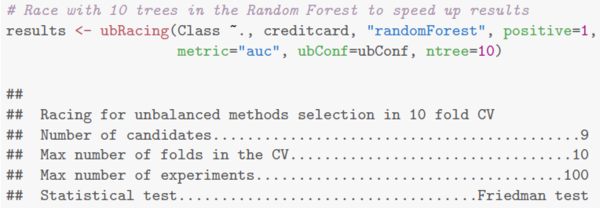
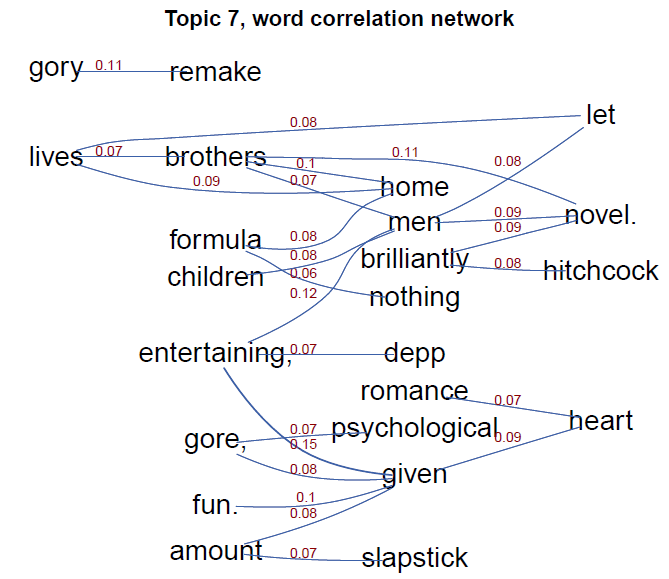
Last week, we had a great course on Text Mining with R at the European Data Innovation Hub. For persons interested in text mining with R, another 1-day crash course is scheduled at the Leuven Statistics Research Center (Belgium) on November 17 (http://lstat.kuleuven.be/training/coursedescriptions/text-mining-with-r). The following elements are covered in the course.
Import of (structured) text data with focus on text encodings. Detection of language
Waw, our course list for teaching R is getting bigger and bigger. We have now courses on basic, R, advanced R, R package building, statistical machine learning with R, text mining with R and spatial analysis with R. All face-to-face courses given in Belgium and scheduled in the coming months.
Some courses are given at the European Data Innovation Hub (Brussels, Belgium), other courses are given through the Leuven Statistics Research Center (Leuven, Belgium). From today on, you can register for the following courses regarding the use of R. Prices are set to 300€ per course day + taxes. For detailed information on the course content, have a look at the pdf which can be found here.

 Last call for registration of the course on Advanced R programming topics.
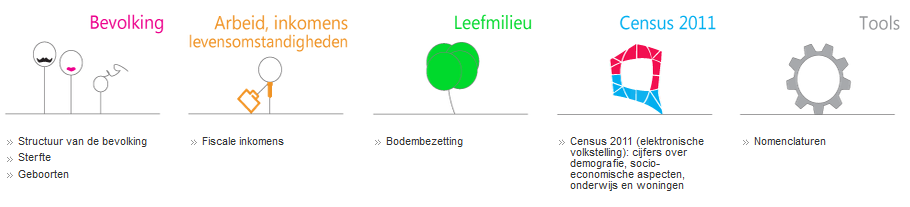

